Creating data visualization projects for social impact

Working in a specialised design studio allowed me to apply my graphic design expertise to digital products and strengthened my ability to unite multidisciplinary teams. Through effective facilitation, I helped set goals and define project parameters, ensuring successful collaboration and outcomes

About Cafe

Award-winning studio that combines design and technology to drive change by designing and delivering interactive data visualisations tools, data-driven dashboards, and websites for projects that are tackling the UN's 2030 Agenda for Sustainable Development.

https://cafe.art.br/

Assassination Monitor

https://assassination.globalinitiative.net/monitor/

Context

Assassination Monitor is a quantitative analysis website that forms part of the Faces of Assassination project by the Global Initiative Against Transnational Organized Crime. The goal of this analysis is to provide a comprehensive overview of political crimes worldwide, allowing users to compare data using two parameters: geographic and thematic. The geographic parameter includes global, continental, and regional analysis, while the thematic parameter covers aspects such as target group, motive, method, and perpetrator.

Main activities

  • Data base review to prototype the data in different forms and check which ones would better explain their analysis.
  • Work alongside the customer to define the website's structure and its visuals.
  • Work status presentation and pitch deck for customer's evaluation and approval
  • Handover to the internal development team and implementation review

Geographic and Thematic analysis structuring

Problem space

The project faced two main challenges. For the geographic analysis, the database showed significant case discrepancies between countries due to factors like size, development level, and data availability. Our goal was to present a balanced map view while considering these factors. For the thematic analysis, we needed to provide enough data granularity to allow filtering by multiple parameters without identifying individual cases, ensuring anonymity and avoid repeating the existent qualitative analysis.

Approach

We experimented with various data formats to find the most accurate representation. For the geographic analysis, we used both bubble and heat maps, opting for the median value to balance the scale and avoid skewed results. In the thematic analysis, we focused on emphasising the target group and motive while providing a brief overview of method and perpetrator, as these were more sensitive and less central to the report.

Main achievements

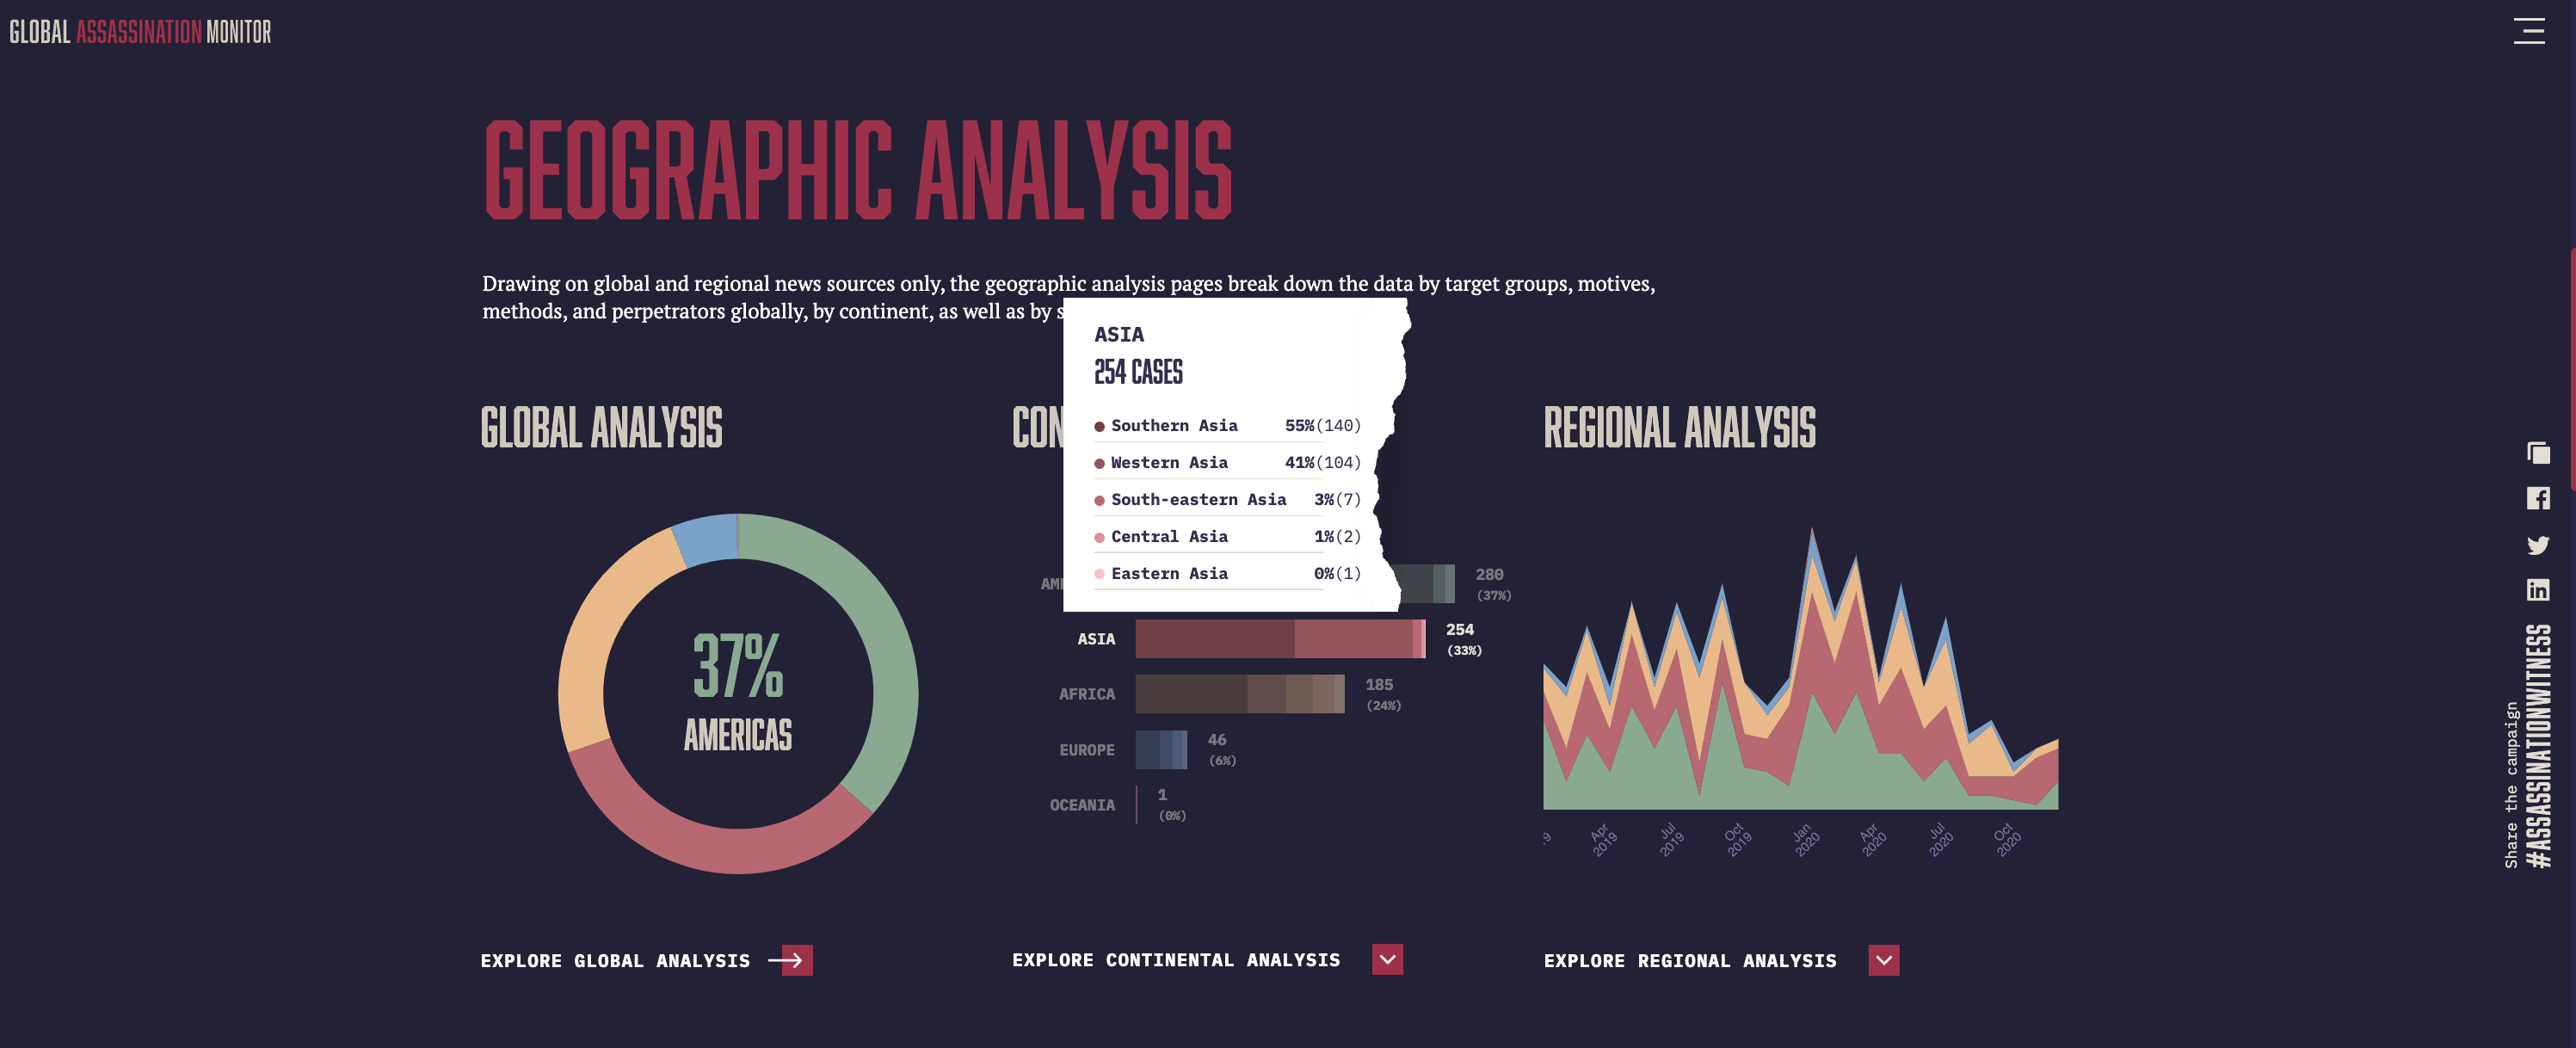
Interactive charts on landing page

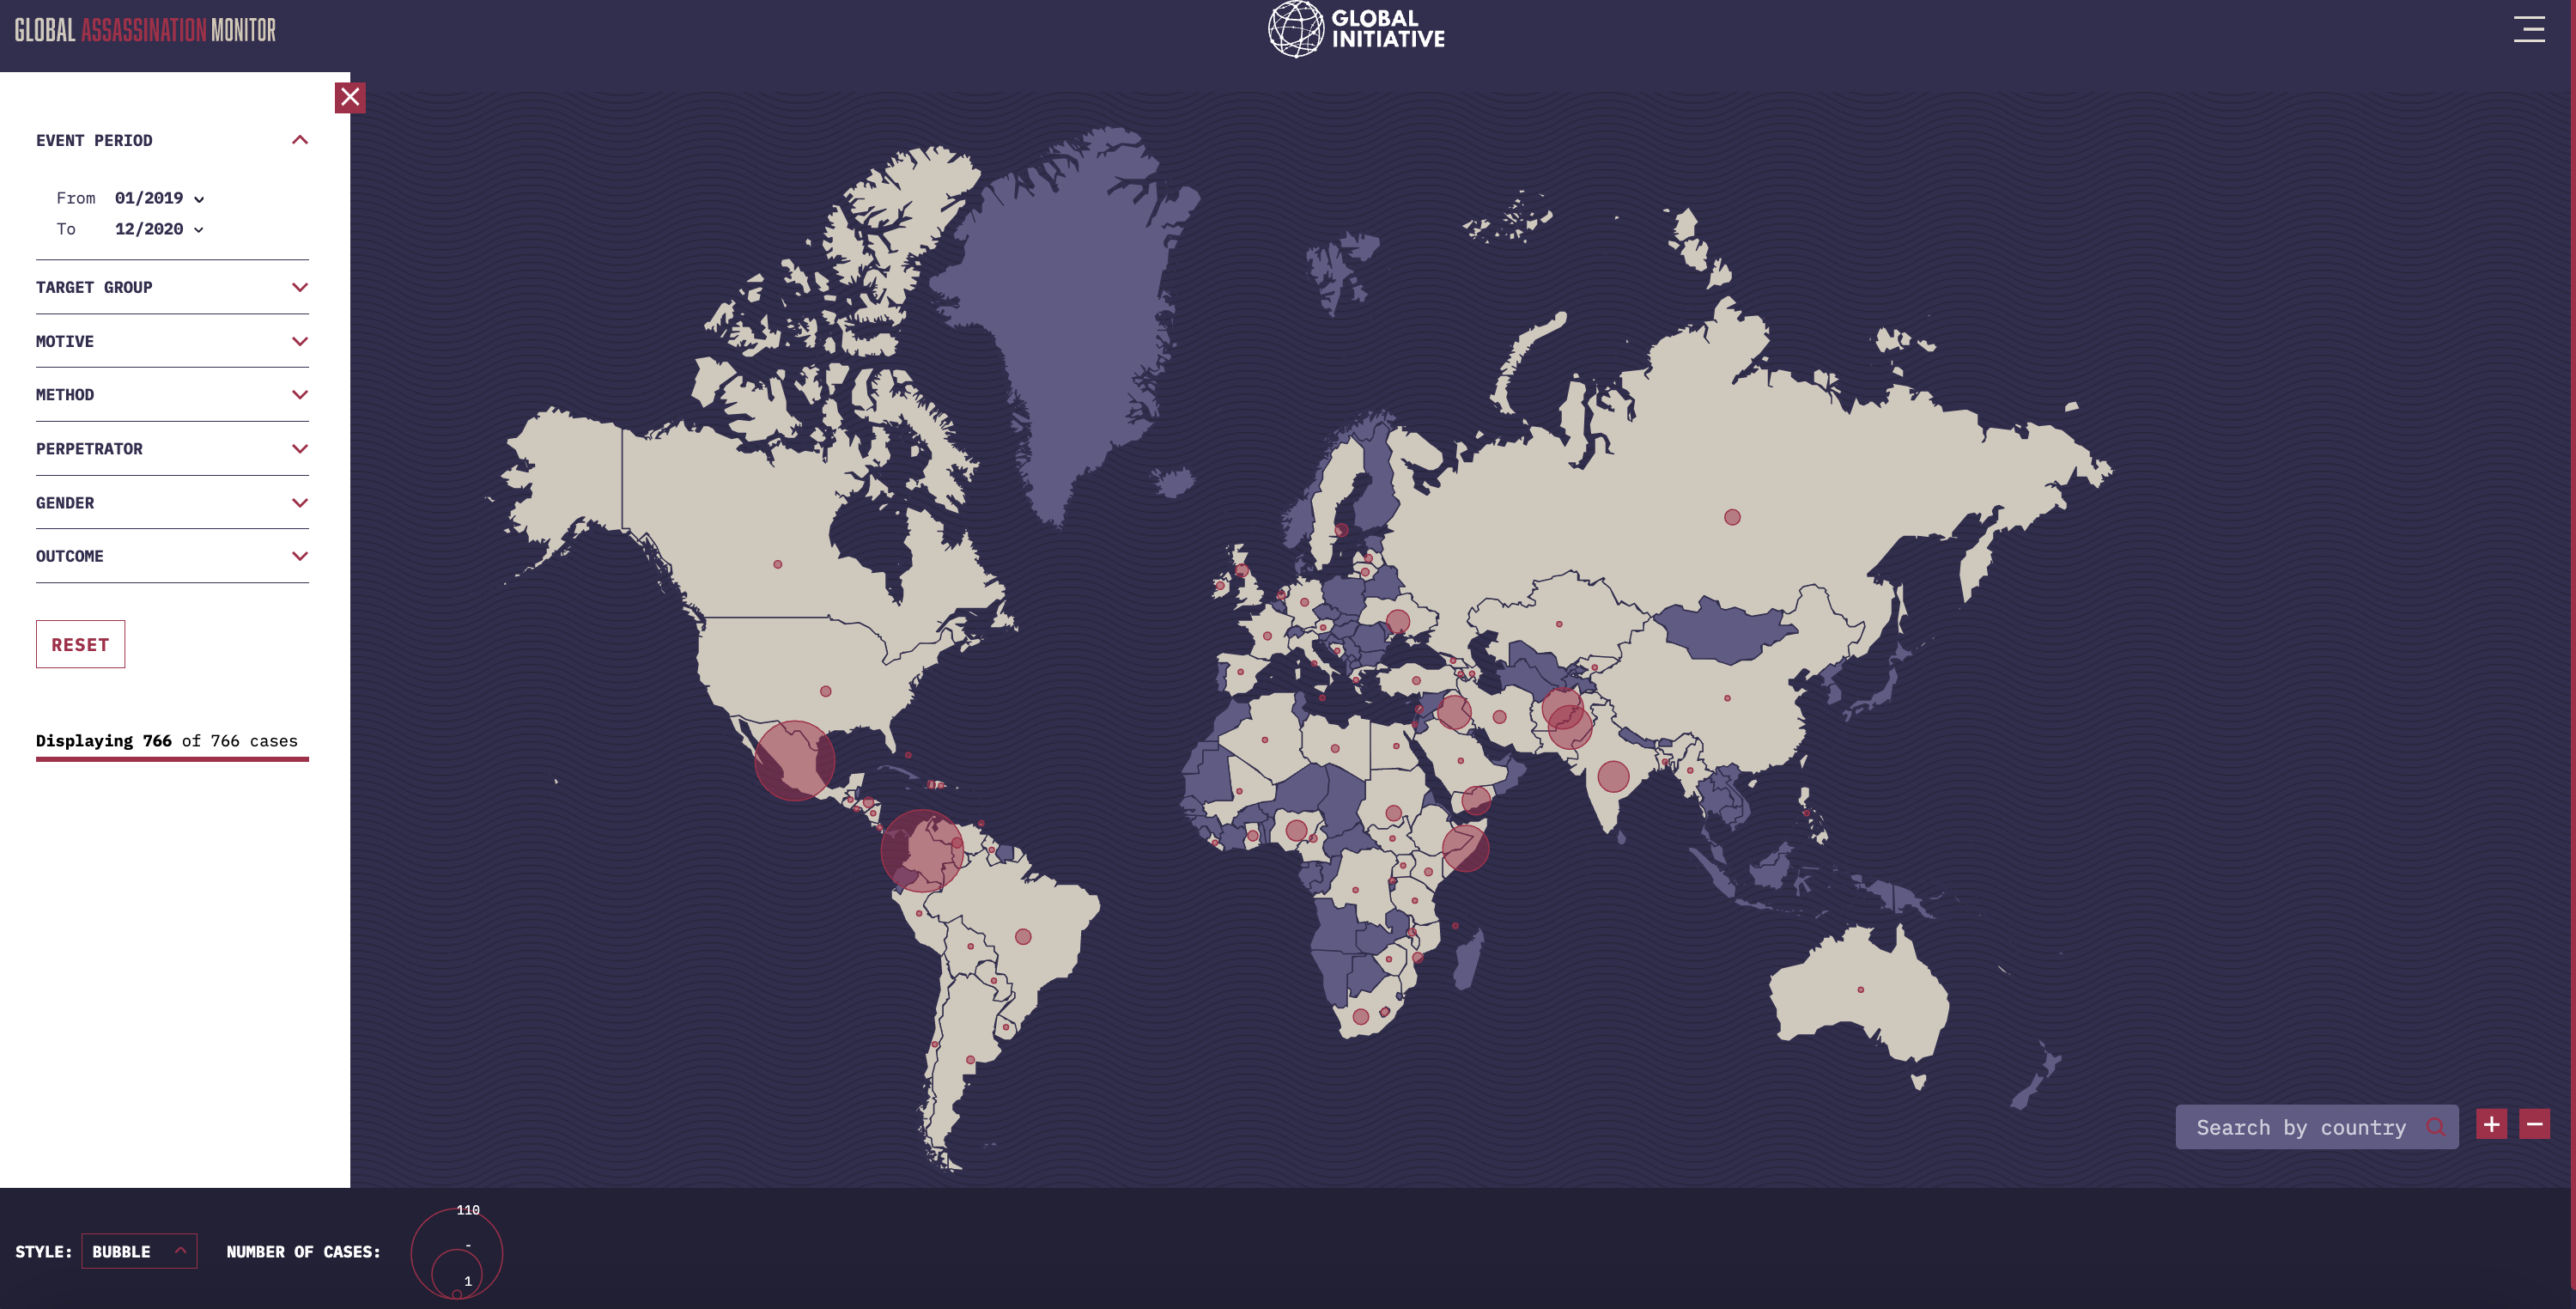
Map view and filters
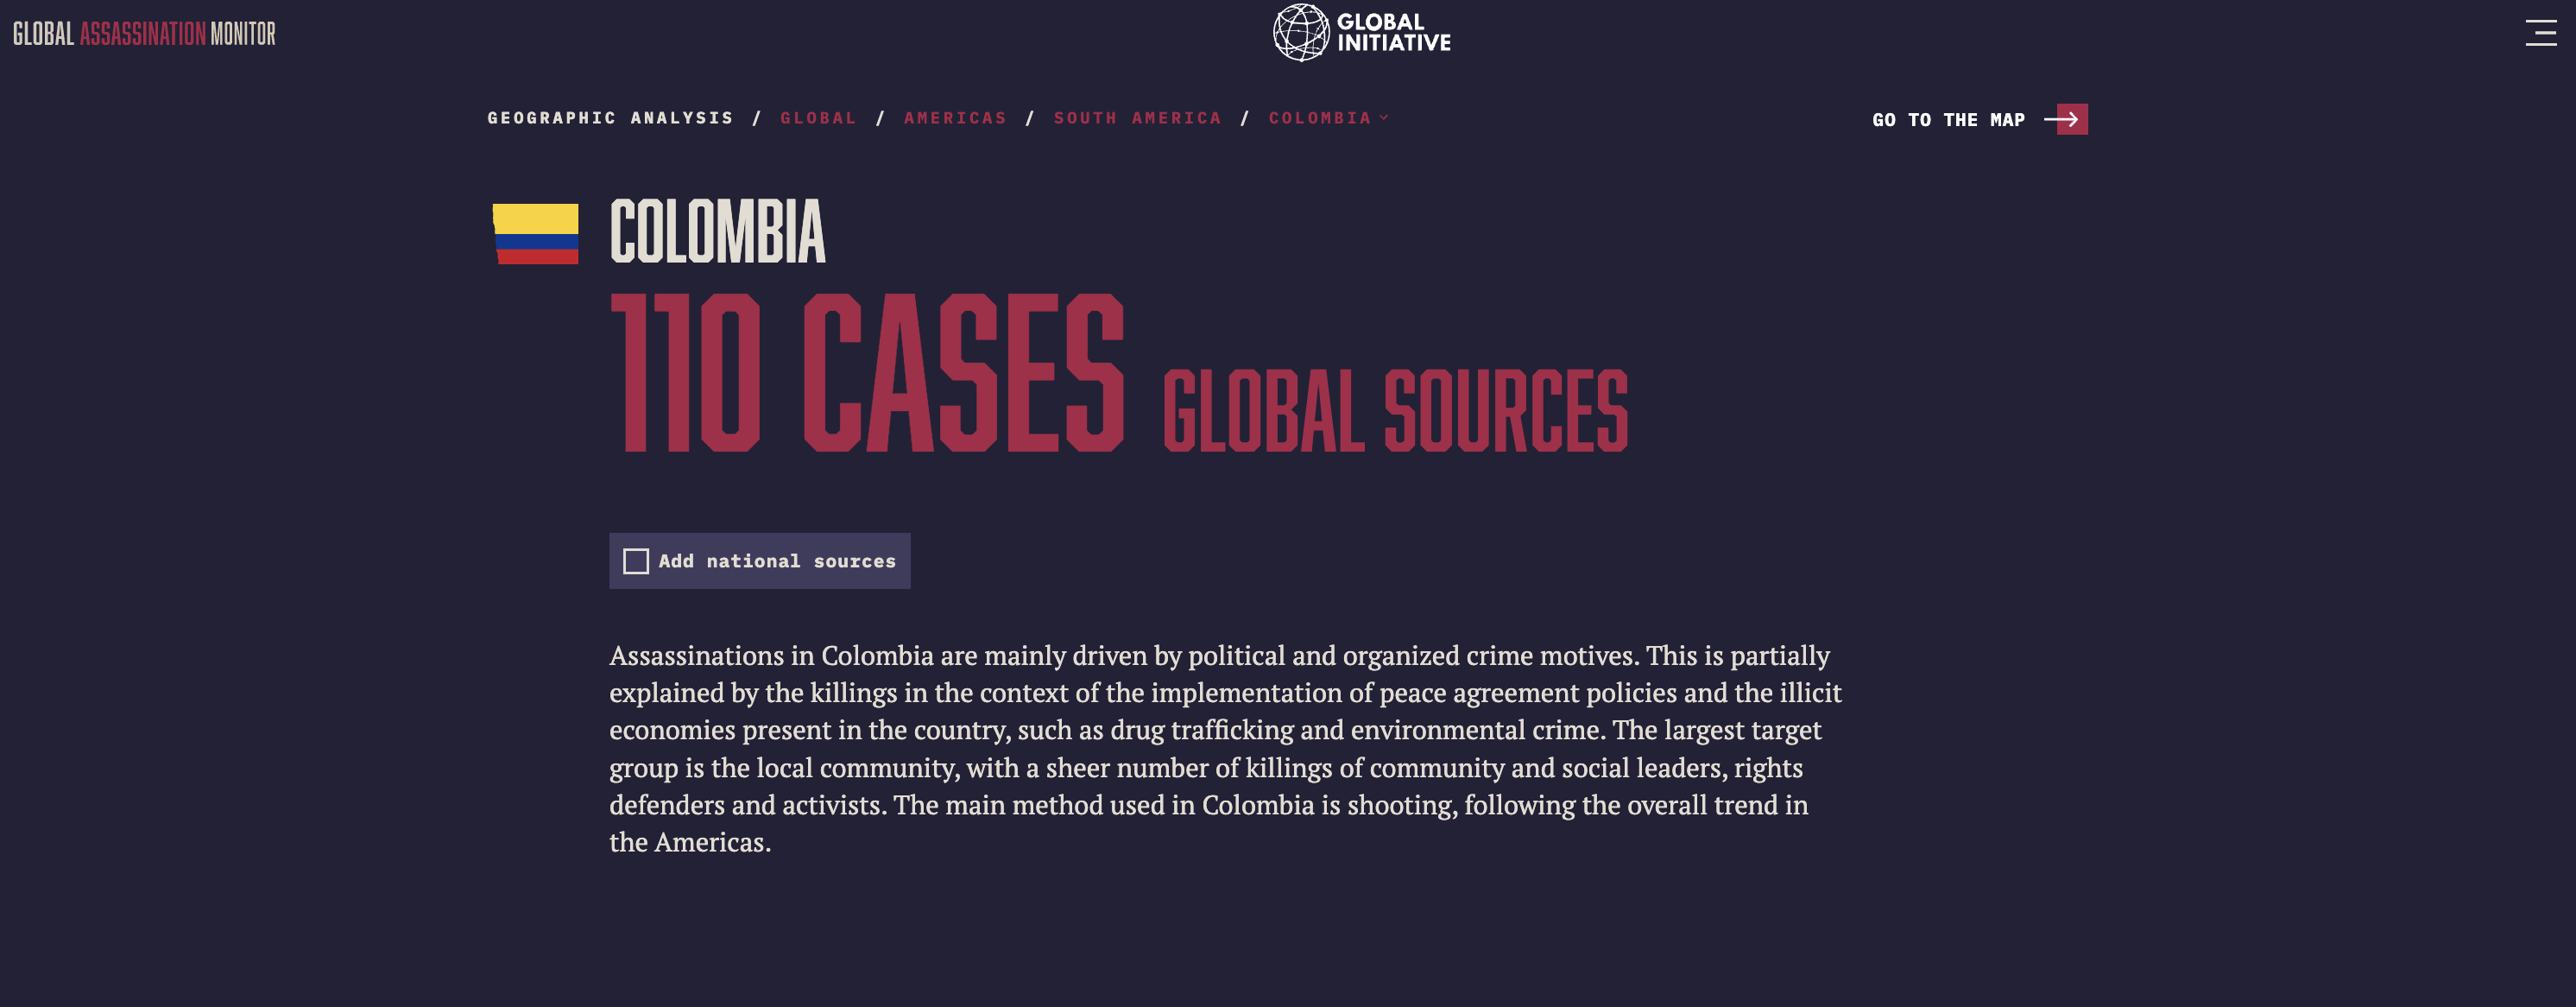
Country analysis

B3 Brazilian stock exchange's new data screens

https://www.b3.com.br/pt_br/para-voce

Coming soon